


As global Quality Growth investors, we are often asked by clients whether we have been able to generate new ideas outside of the long-established North American and European equity markets, specifically across Asia-Pacific. Seilern has always been a developed markets investor, which means that we are unlikely to ever have direct, listed market exposure to the booming growth that one could observe by simply taking a stroll through cities such as Bangalore, Shenzhen, Ho Chi Minh and Jakarta.
Despite this, we have always been able to gain indirect exposure to these growth regions via the safety of developed market listings. Indeed, around 20 per cent of the aggregate revenue exposure of the companies in the Seilern World Growth fund today come from Asia-Pacific. However, given that over 60 per cent of the world’s population lives in the region, it’s important to assess what opportunities exist across the developed markets we can directly access, namely Japan, South Korea, Australia and New Zealand.
During 2023, members of the Seilern team conducted a six month research project to attempt to answer this question. As the reader will recall, the Seilern investment philosophy is highly exclusionary, in which almost 99 per cent of all listed companies are immediately excluded based on a number of strict hurdles (The Power of Exclusion). The starting point for our in-depth, qualitative research therefore begins from the output of this exclusionary screen, summarised below.
Table 1: Potential Investible Universe by OECD Region
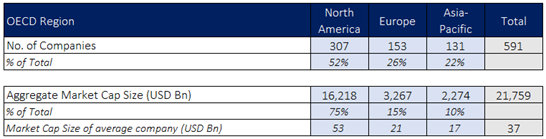
Source: Factset, 2023, Seilern Investment Management Ltd
The first observation is that there are simply fewer companies across OECD Asia-Pacific countries which meet our requirements for further investigation (22 per cent, compared to 52 per cent in North America). These companies also tend to be much smaller, having an average market capitalisation of only $17 billion compared to $53 billion for their US peers. However, looking at the data reveals that Japan actually represents 101 of these 131 names (nearly 80 per cent), making it a larger potential Quality Growth market than the UK, France, Germany, Switzerland and Italy combined.
Figure 1: Number of companies in Potential Investible Universe
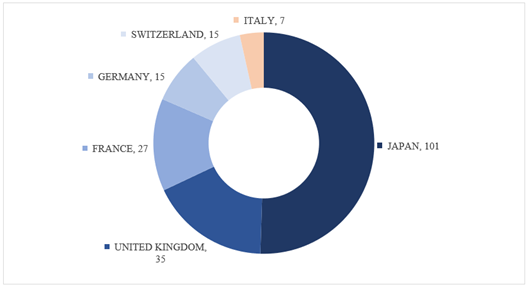
Source: Factset, 2023, Seilern Investment Management Ltd
Our next step was to make an initial assessment of the quality and growth attributes of each region. Below you can see a table with the breakdown of key characteristics like sales and profit growth. What is revealed here is that growth across North America has been noticeably higher than both Europe and Asia-Pacific, and North American companies have achieved a higher level of growth consistency over the past decade. This is an important consideration given that we are trying to find companies with a high level of earnings predictability and forecastability, which greatly improves our ability to accurately value them.
Table 2: Growth Characteristics of the Potential Investible Universe by OECD Region
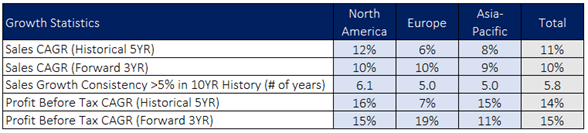
Source: Factset, 2023, Seilern Investment Management Ltd
Based solely on the above, an astute observer might conclude that Europe has actually been the worst region to invest in due to its lower growth rate. While they certainly wouldn’t be wrong with that initial assessment, it is the quality of that growth which needs to be analysed.
The below table illustrates the importance of looking at the other side of the Quality Growth coin. Whilst Asia-Pacific companies, specifically Japanese companies, might have experienced faster rates of growth historically, this growth has been achieved with a lower gross and operating margin, a lower return on invested capital, a much higher capital intensity, and a much lower free cash flow margin. In other words, companies across Asia-Pacific simply generate less excess free cashflow for shareholders.
Table 3: Quality Characteristics of the Potential Investible Universe by OECD Region
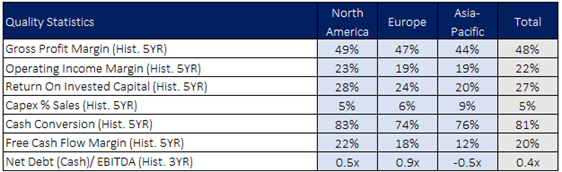
Source: Factset, 2023, Seilern Investment Management Ltd
Where Asia-Pacific companies do stand out is by having significantly less balance sheet leverage. Here you’ll often find Japanese companies sitting on large stockpiles of cash which, until recently, were earning zero or even negative real returns.1 We have always believed that greater long-term value tends to be generated by companies which are able to either deploy excess free cashflow into attractive future growth prospects or return it to shareholders, rather than hoard it because of conservative boardrooms.
The above analysis was done prior to reviewing each of these 131 companies. The deeper qualitative analysis that was conducted afterwards resulted in the following five lessons from Asia-Pacific equity markets. These lessons are an excellent illustration of why this has been such a challenging market for Seilern to find great, long-term Quality Growth investments:
- Many companies are conglomerates with complex corporate ownership structures. In Japan, business culture often involves Keiretsu,2 a unique organisation of enterprises with interlocking business relationships and shareholdings. Over time, this system has led to fewer, larger conglomerates dominating the market, rather than a multitude of separate, efficiently run companies. In our eyes, conglomerates tend to be poor allocators of capital as politics and strategic investments often get in the way of economically optimal decisions, thus diluting the return profiles of the better run businesses within the group. Understanding who ultimately runs the company and, therefore, gaining confidence that there is alignment with long-term, minority ownership remains a major hurdle across this region. It also leads to smaller market capitalisation free floats available for minority investors such as Seilern, creating potential liquidity constraints for our funds. Adding all of these together with the fact that many companies today still only report their financial results in Japanese, and one can see why international investors have had such a hard time getting comfortable with the corporate governance of these companies.
- Many companies face enormous pricing competition from cheaper Chinese substitutes. Interestingly, consumer discretionary is actually the largest sector in Japan at over 20 per cent of the Nikkei 225, with industrials a close second at 19 per cent. The key issue we uncovered here was that many well-established consumer companies were simply running out of domestic growth opportunities and having a difficult time replicating their own business models around the world (usually because of poor market/product fit and cultural integration issues). A number of Japanese companies have attempted to expand into China, only to find that domestic competition has been far more intense than they had anticipated. At the same time, many Japanese companies are also facing a rising tide of cheaper alternatives arriving into their own domestic market from countries all across South-East Asia, which has led to incremental margin erosion.
- Many companies sell increasingly commoditised industrial products. Much like the point raised above, Japan is home to an incredible number of successful industrial manufacturing businesses which have enjoyed decades of export growth and technological innovation. However, it appears as though Japan’s lead across this sprawling sector has narrowed significantly over recent years given the plateauing innovation curve, and many of these industrial businesses are now only achieving growth via market consolidation (i.e. acquisitions) rather than via organic means. When pricing power begins to fade, it becomes incredibly challenging to sustain long-term growth to defend your return on capital.
- Many companies operate low margin businesses within cyclical end markets. Nearly 60 per cent of all the companies in our Asia-Pacific list had an operating profit margin less than 15 per cent, and across Japanese companies this rose to almost 70 per cent. This compares to an operating profit margin of 25 per cent forthe average Seilern Universe company. The key issue is not specifically that these are low margin businesses, but rather that this characteristic is combined with their exposure to more cyclical end markets. These include industries such as machinery manufacturing, computer hardware, food production and higher risk biopharmaceuticals. Ultimately, the types of companies we invest in tend to have growth drivers which are independent of the economic cycle (Cycles and Sectors: The Market Timing Maze). And even if they end up being negatively impacted by a sharp recession, the fact that they operate with such high margins to begin with, helps insulate them from having to cut down on critical investment needs for future growth ambitions.
- Many high-growth companies are exposed to the semiconductor industry. Delving deeper we found that around 10 per cent of these companies provide capital equipment and services into the broader semiconductor industry, particularly across Japan and South Korea. Whilst there is no doubt that the growth prospects in sections of the industry are excellent, we believe that there has always been a high degree of technological turnover in the semi space due to its short product lifecycles. More importantly, the price of this turnover is extremely high, leading to an industry structure which can be characterised as boom and bust. The reality is that we have seen technological leaders within the semi industry be violently displaced many times over the decades due to their inability to consistently (and predictably) stay ahead of the innovation curve. Unfortunately, we do not think that this underlying characteristic has changed with the latest bout of semi euphoria.
Having said all of the above, it is certainly not all bad news. Whilst we excluded over 90 per cent of these companies, we were still able to identify around 10 new and interesting ideas across Asia-Pacific which will now enter our pipeline for deeper research. These include some specialised medical device companies, a monitoring and control sensor company, a niche sporting goods company, a professional data and services provider, and a number of diversified enterprise management software businesses. Of these, seven are Japanese, two Australian, and one is a little battler all the way from New Zealand.
We are, ultimately, regionally agnostic global investors at Seilern, believing that we can gain wide ranging exposures to secular growth drivers across Asia-Pacific, without having to access those end markets directly. Furthermore, there have been significant structural issues regarding certain markets over the decades, most notably in Japan. Of course, the story there could always change and, indeed, it’s rare to see a story about the Land of the Rising Sun in the financial media these days, without getting a sense that there are large corporate governance shake-ups afoot. Only time will tell, and we have certainly heard this tune before. Nonetheless, investing is frequently an opportunity cost game, and for now, our bottom-up analysis clearly indicates that the best mix of Quality Growth opportunities continues to exist across North America and Europe. We would be foolish to not pay attention to the fundamentals.
1According to the Wall Street Journal, in 2022, Japanese companies were sitting on $1 trillion in cash, equivalent to 17 per cent of their market capitalisation (compared to only 5 per cent for their US peers). Quite incredible, given that Japanese GDP is only $4.3 trillion.
2Similar to the Chaebol corporate structures in South Korea.
This is a marketing communication / financial promotion that is intended for information purposes only. Any forecasts, opinions, goals, strategies, outlooks and or estimates and expectations or other non-historical commentary contained herein or expressed in this document are based on current forecasts, opinions and or estimates and expectations only, and are considered “forward looking statements”. Forward-looking statements are subject to risks and uncertainties that may cause actual future results to be different from expectations.
Nothing contained herein is a recommendation or an offer or solicitation for the purchase or sale of any financial instrument. The material is not intended to provide, and should not be relied on for, accounting, legal or tax advice, or investment advice. The content and any data services and information available from public sources used in the creation of this communication are believed to be reliable but no assurances or warranties are given. No responsibility or liability shall be accepted for amending, correcting, or updating any information contained herein.
Please be aware that past performance should not be seen as an indication of future performance. The value of any investments and or financial instruments included in this website and the income derived from them may fluctuate and investors may not receive back the amount originally invested. In addition, currency movements may also cause the value of investments to rise or fall.
This content is not intended for use by U.S. Persons. It may be used by branches or agencies of banks or insurance companies organised and/or regulated under U.S. federal or state law, acting on behalf of or distributing to non-U.S. Persons. This material must not be further distributed to clients of such branches or agencies or to the general public.
Get the latest insights & events direct to your inbox
"*" indicates required fields