


“Good things come to those who wait”, you may recall, was the strap line for a highly successful series of adverts for Guinness at the turn of the century. The most memorable of which, “The Surfer” showed a close up of a man studying the horizon, while a pounding, rumbling drum beat builds into a crescendo as he waits for the right moment, before he and his fellow surfers dive into the sea, desperate to catch the perfect, enormous, Hawaiian wave. With the S&P 500 having recently made it back to all-time highs, investors may wonder in a similar way whether now is the right time to invest. Will they catch the perfect wave and ride on victorious to the safety of dry land, or is it already too late and jumping in now will only lead to a crashing fall in a few months’ time?
It goes without saying that, aside from metaphors, surfing and investing have little in common. Even the apparent necessity for patience is different. Whereas in surfing patience is required to time your entry to catch the wave, in investing patience means being comfortable staying invested. Such patience can be difficult if you are worried about incurring losses but, as we will demonstrate below, if your time horizon is long enough, the chance of making a loss is practically zero.
Patience is powerful
We have written previously about the perils of market timing, and notably the large drag on performance that comes from being mistakenly out of the market on days when it rallies strongly (Market Timing). Being patient and staying fully invested avoids many of these pitfalls, enabling the prudent investor to take advantage of compounding. Patience doesn’t just help the investor in their efforts to accumulate wealth though. It also helps with capital preservation. This has held true for equity investments in the past, and we believe the case should be even stronger for Quality Growth: the high levels of earnings growth should bail out companies sooner and the high quality means they are less likely to encounter difficulties in the first place.
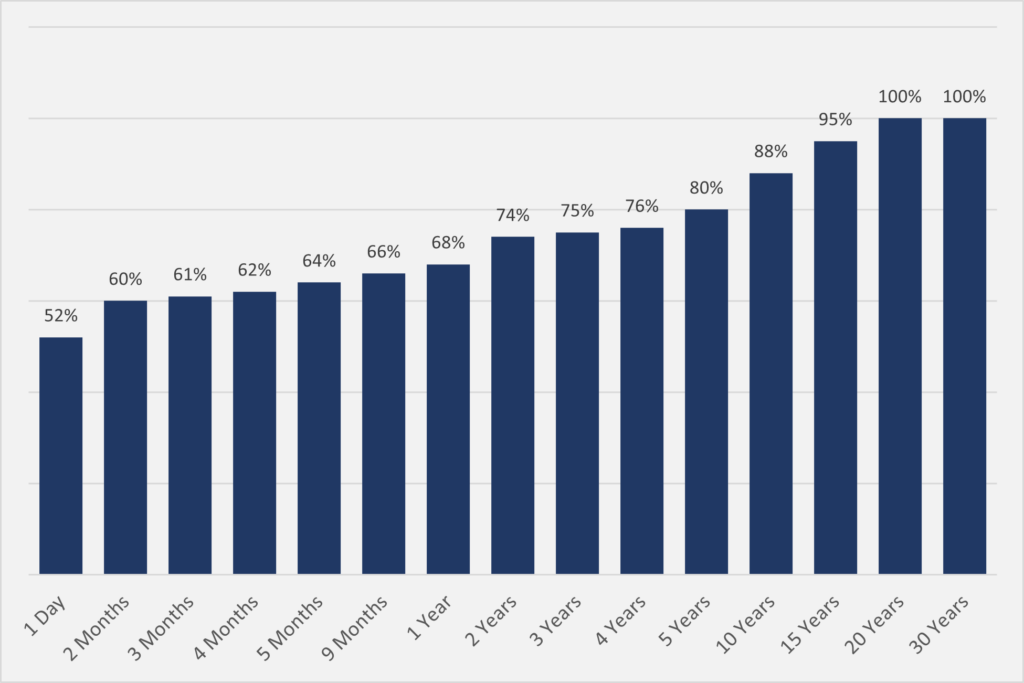
If we look at stock market returns going back to 1871,1 we can clearly see the power of long-term investing. Putting your money to work on a daily basis is little better than a coin toss. Extending your time horizon to a year improves things, giving a 2/3 chance of a positive return. If you can hold out for five years, the odds start to look stacked in your favour, with a positive return occurring 80 per cent of the time. For some, a 20 per cent chance of making a loss over five years is still not good enough. Yet the data demonstrates that, if you want more certainty you just need to lengthen your horizon. If you could stand to wait for 20 years, no matter when you invested you would have guaranteed a positive return.
Figure 1: U.S. Stocks: Per cent of Periods That Earned a Positive Return (1871-2018). Inflation & Dividend adjusted
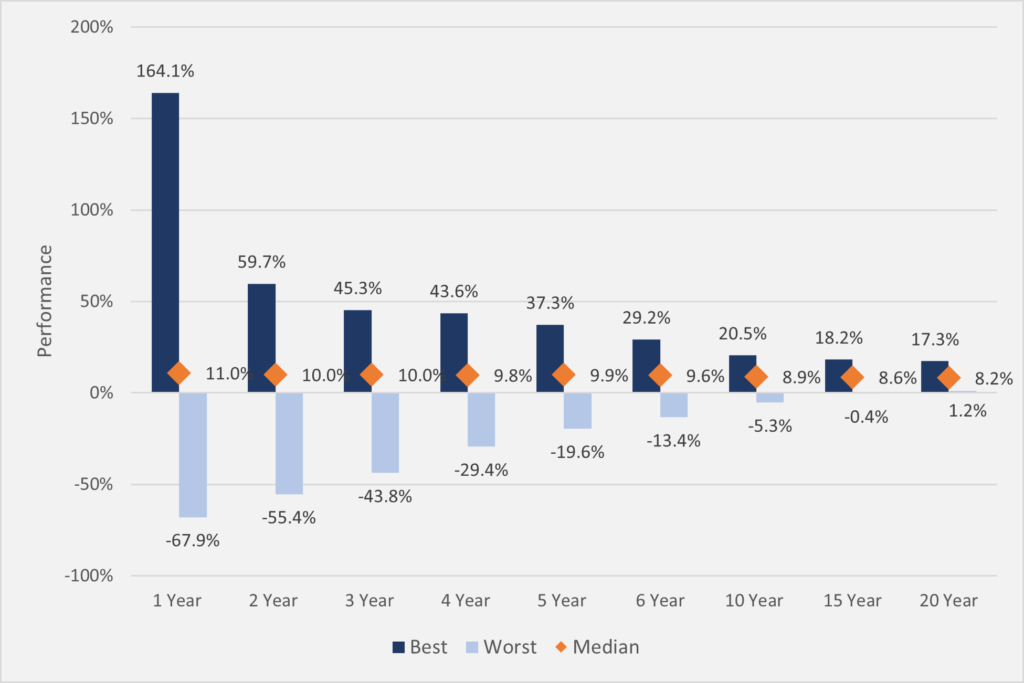
Of course, here we are merely focussing on ensuring a positive return and therefore the worst possible outcome. The other side of the patient coin is compounding, which means your average and maximum returns are far in excess of this minimum amount. Below is a chart showing the best, worst and median returns over different holding periods, for the US Index going back to 1871.2The worst 12 month return during this period was -67.9 per cent which was the return you would have got if you had invested in June 1931, in the midst of the Great Depression, a year before the market bottomed. And the maximum was +164.1 per cent, which was the return you would have got if you had resisted the temptation to capitulate and held on to that same investment in June 1932.
The worst 20-year return, however, was a positive CAGR of +1.2 per cent, which translates into a +27 per cent total return. Not great, but not so bad when you consider you would have invested at the peak of the “Roaring Twenties” and that the period included the Wall Street Crash, the Great Depression, an -80 per cent draw down and the Second World War.
Figure 2: S&P 500 Best and Worst Returns – Rolling Periods (Annualised) Since 1871
In fact, there is quite an amazing stat that if you can extend your holding period to 30 years, the minimum annualised return you would have made would have been +7.8 per cent, for a total return of +850 per cent. Just to reiterate that point, if you had the most unfortunate timing of all and put your money to work at the worst possible time over the past 100 years, as long as you could wait out for 30 years, you wouldn’t have been far off making 10 times your money.2F[1]
When it comes to the Quality Growth companies in the Seilern Universe, one would hope that the waiting time would be shorter and the rewards even greater. All of these companies have resilient business models which drive sustainable and above average earnings growth. While we know that macroeconomic events can overtake markets and that short-term issues can affect our companies, over the long run it is earnings that drive share prices.
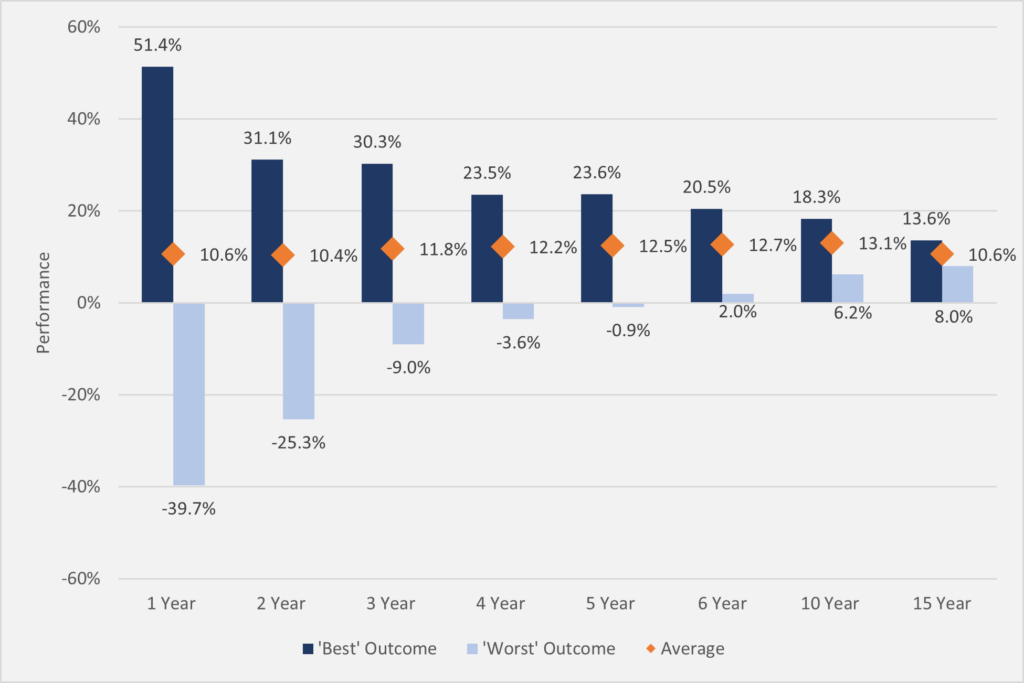
The data for our World Growth USD U I (SWG) share class runs back to 2006. This period hasn’t endured quite as many ups and downs as the past 150 years, but it still includes the GFC and the COVID pandemic as well as numerous large market draw downs. During this period, you would only have had to wait six years to achieve a positive return, no matter when you invested. And the worst annualised return, of all these different six-year periods, is +2.0 per cent. Taking this one step further, the worst 10 year holding period annualises at +6.2 per cent, giving a total return of +82.5 per cent. So even if you had invested right at the peak in 2007, if you had managed to hold your nerve through a -45 per cent draw down, and then carried on holding for a further eight years, you would have seen your investment grow by over +80 per cent.
Figure 3: Seilern World Growth Best and Worst Returns – Rolling Periods (Annualised)
If we compare these returns to those of the MSCI World, we can see that patience still pays off, but to a lesser degree. A six-year holding period in the MSCI World index over this period still gets you to a positive, albeit paltry, return of +0.3 per cent. Over 10 years, the worst return is +3.8 per cent annualised for a total return of +45 per cent.
Reaching new highs
The elephant in the room is that, unlike the MSCI World and S&P 500 indices, SWG is still -9 per cent below its 2021 peak. At that time, with our concentrated exposure to long duration Quality Growth, many of these companies hit meteoric highs with interest rates at record lows. We are therefore not too surprised that it has taken us a little longer to regain those highs. And given that interest rates have more than quadrupled since that point, we are reassured by the level of earnings growth from our companies, which has helped to offset the compression in valuation from higher rates.
In their advert Guinness used the patient surfer as an analogy for the supposed rewards that come with waiting for a pint. But there is a world of difference between delaying gratification by two minutes, and waiting out weeks, months and years for positive performance. What makes waiting especially hard is not knowing whether you will get anything in the end. A surfer can see waves breaking and a customer can see the progress of the barman. For our investors the track record of both the indices and our funds, along with the resilient earnings growth and strong prospects for our companies, should make that wait a little more comfortable even if, sometimes, it takes a little longer than the time it takes to pour a Guinness.
1S&P 500 data only extends back to 1957. Prior to this there was an S&P 90 and weekly data that extended back to 1925. The 1871 to 1925 period uses the ‘Cowles’s extension’, created by Alfred Cowles to generate a synthetic index from all stocks quoted on the New York Stock Exchange in 1871. (see “An Analysis of the S&P 500 Index and Cowles’s Extensions: Price Indexes and Stock Returns, 1870-1999, Jack W. Wilson and Charles P. Jones)
2These figures do not adjust for inflation but do include dividends.
3(https://awealthofcommonsense.com/2023/02/deconstructing-10-20-30-year-stock-market-returns/)
4We have provided the USD U I class as it is our largest dollar share class. However, the longest running share class has data going back to 1996. We should note that this is a hedged, retail Swiss Franc Share Class, meaning that it carries a higher fee, hedging costs and also takes in a -45 per cent depreciation against the USD. Nonetheless, the returns for the patient investor are still pretty good. Any 15-year period would have secured a positive return, and over 20 years the worst return is +4.3 per cent annualised (+132 per cent total). This compares favourably to the same analysis of the MSCI World returns over the same time period in Swiss Francs. In this case over a 15-year period, the worst return is still negative at -0.9 per cent (-16.5 per cent total). Over 20 years you would have just about made a positive return, but only to the tune of +0.5 per cent (+10 per cent total).
This is a marketing communication / financial promotion that is intended for information purposes only. Any forecasts, opinions, goals, strategies, outlooks and or estimates and expectations or other non-historical commentary contained herein or expressed in this document are based on current forecasts, opinions and or estimates and expectations only, and are considered “forward looking statements”. Forward-looking statements are subject to risks and uncertainties that may cause actual future results to be different from expectations.
Nothing contained herein is a recommendation or an offer or solicitation for the purchase or sale of any financial instrument. The material is not intended to provide, and should not be relied on for, accounting, legal or tax advice, or investment advice. The content and any data services and information available from public sources used in the creation of this communication are believed to be reliable but no assurances or warranties are given. No responsibility or liability shall be accepted for amending, correcting, or updating any information contained herein.
Please be aware that past performance should not be seen as an indication of future performance. The value of any investments and or financial instruments included in this website and the income derived from them may fluctuate and investors may not receive back the amount originally invested. In addition, currency movements may also cause the value of investments to rise or fall.
This content is not intended for use by U.S. Persons. It may be used by branches or agencies of banks or insurance companies organised and/or regulated under U.S. federal or state law, acting on behalf of or distributing to non-U.S. Persons. This material must not be further distributed to clients of such branches or agencies or to the general public.
Capital at risk
Get the latest insights & events direct to your inbox
"*" indicates required fields