


This time last year, I published a newsletter titled Snow in the Summer, which explored the relationship between stock prices and corporate fundamentals. In brief, I argued that while the theory linking prices and fundamentals is both sound and well-tested, the real world often deviates from it, sometimes sharply and for extended periods.
This raised two questions. First: why do stock prices diverge from earnings in the first place? And second: why, later, do they usually reconverge?
There are a few reasons to consider. Liquidity plays a significant role, most noticeable by its absence during market crashes. Discount rates also play their part, either from changes in underlying interest rates or changes in the risk premia the market attaches to equities. Rapid changes in either tend to deliver shocks to valuations even if the earnings profiles are unchanged. Finally, there is the wildcard of market psychology. Investors often panic at the first sight of danger, driving stock prices lower than earnings suggest and equally pile into winning themes with enthusiasm, oblivious of the inherent risks in doing so.
One might imagine that patient capital would counterbalance this skittishness, but it simply does not carry enough weight. The ‘marginal investor’1 appears to have changed in two ways – first, as passive investments and retail trading has grown, there are structurally fewer long-term active investors. Second, even within active management, investment horizons have contracted, with shorter-dated, momentum-driven strategies dominating the market.
Figure 1: Estimated Breakdown of US Equity Volume by Market Participant, 2024
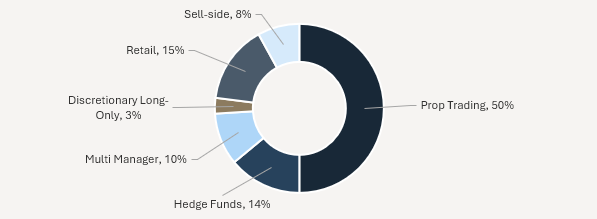
The consequences are predictable. As the share of the market that is trying to accurately price a stock’s long-term credentials has shrunk, we have seen an increase in the frequency that stock prices disconnect from earnings. Next, stock momentum and benchmark-hugging has driven investors to routinely over- or underestimate business prospects, with little incentive in the near term to take a stance against the market. Finally, discretionary, long-only managers are amongst the longest-term thinkers in the market. Shrinking their influence allows short-termism to creep in distorting behaviour by focusing on the next quarter and year-end as the finish lines, with managers effectively trying to win a marathon by running a series of 100 metre sprints.
To be clear, Quality Growth companies themselves are not immune from this effect, and we have seen their stock volatility increase too. However, as a group, Quality Growth equities enjoy a great deal of stability when packaged into a fund that carefully balances real business risks and, as we shall see below, enjoys a greater degree of earnings stability than the broader market.
Short-sighted?
While mispricings are common, over long timeframes fundamentals reassert themselves as we have learned several times both to our advantage and our detriment. The answer to why this happens lies in the mechanics of how these companies are valued. The workhorse of valuation, the discounted cash flow, posits that the value of a stock is equal to the present value of its future cash flows. P/E ratios make a similar link between earnings and stock prices by way of a ‘fair value’ multiplier. By extension, an equity fund is a collection of stocks with a minor exception,2 these funds tend to be an accurate reflection of their underlying holdings.
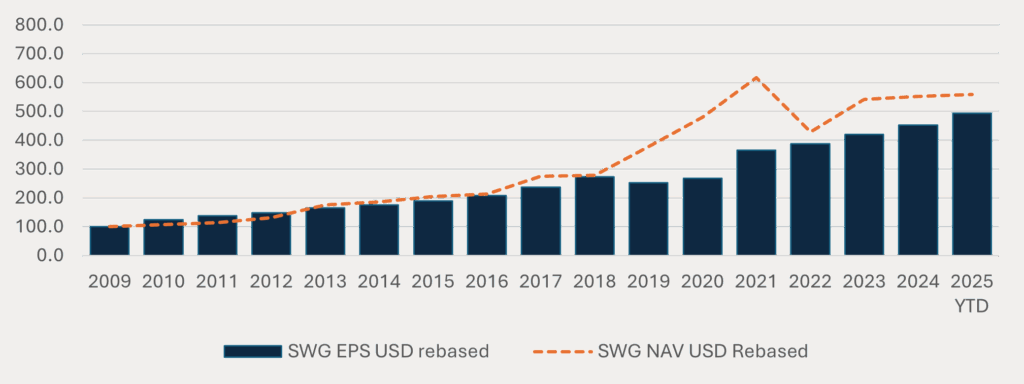
Over the long term, the degree of concordance between earnings growth and stock prices is striking, something we have discussed for the broader market before. We have further illustrated this same dynamic below with respect to Seilern World Growth, illustrating the tenet of our philosophy that over the long term, earnings drive share prices, and share prices drive the NAV’s of the funds.
Table 1: Seilern World Growth (SWG) EPS Growth vs NAV Growth

Critics may argue that there is a lot hidden in an average, and they are of course right – large stock drawdowns are buried in the mean (incidentally, so too are stock rallies, but investors often care less about them). Yet, this is precisely the point. The compound growth rate of the NAV matches earnings despite all of the moving parts within, including every single stock drawdown in the sample period. In fact, such is the style that since 2009, the NAV has largely tracked the earnings with the exception of the 2019-2021 period.
Figure 2: Seilern World Growth EPS USD vs. NAV – (2009 to 31 August 2025)
These earnings have compounded at a higher rate than the index over the period but, more importantly, have done so in a more stable fashion, only seeing one decline in earnings (in local currency) in 2020 of -11.7 per cent versus an average of -12.9 per cent for the S&P 500 for the three occasions that it fell over the same period (2009 to 2025).
Figure 3: Seilern World Growth EPS excl. cash (2009 to 31 August 2025)
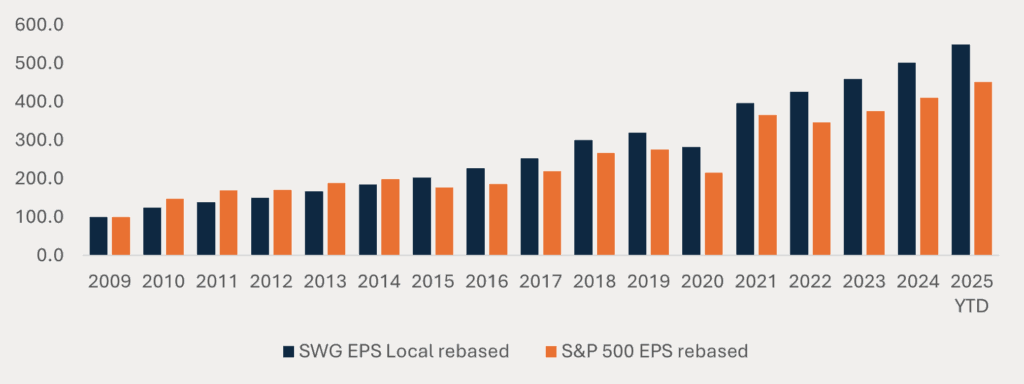
A large part of this is due to the fact that our Quality Growth style prioritises companies that satisfy our 10 Golden Rules framework, which, by definition, avoids unprofitable firms and many fast-growing but immature businesses. It also tends to exclude highly cyclical names, some of which are currently the darlings of the stock market, but participate in industries that are, by definition, subject to reversion.
It is not just that the market has had less stable earnings growth that is a concern. There has also been a marked difference in the rate at which the underlying companies’ earnings and their prices have compounded, something that ought to at least raise eyebrows.
Table 2: S&P 500 EPS Growth vs S&P 500 NAV Growth

The cause of this is much debated, though it is clear that investor enthusiasm has inflated specific corners of the market. Artificial Intelligence (AI) is the latest theme, benefiting not just the enablers (infrastructure builders) but also the energy sector, both renewable and not, which is also enjoying windfall profits.
AI and, more importantly, investor perception of the earnings they expect it to generate have been the driving force behind the 19.5 per cent compounded growth rate that the market has enjoyed over the last three years.3 We are of course not the first to point out that the market may be reflecting inflated expectations on top of an inflated earnings base.
Figure 4: S&P 500 EPS vs. S&P 500 NAV – (2009 to 31 August 2025)

Tied to earnings
Our role as a Quality Growth manager is not to chase benchmarks inflated by companies that do not meet our criteria but to deliver the long-term earnings growth of high-quality businesses. Counter intuitive as it may seem at the moment, a Quality Growth strategy carries less risk than the market precisely because it is more disciplined in its selection. This is because a Quality Growth fund has a constant yardstick with which to define itself – we have the 10 Golden Rules – versus an index that prioritises liquidity in its inclusion criteria.4 As we have also discussed, it does not have any portfolio construction mechanism to correct for over-valuation.
Importantly, the NAV ‘ship’ can only drift so far beyond where the earnings ‘anchor’ lies – a fund cannot indefinitely outgrow the earnings of its underlying companies any more than a business can indefinitely outgrow the underlying industry growth.
When the NAV grows faster than earnings, returns are merely being pulled forward, borrowed from the future. Unless there is convincing evidence that earnings growth will accelerate materially (and sustainably), price must ultimately correct to fundamentals. In our experience, it is usually the stock prices that sharply inflect to match earnings growth rather than the other way around.
1This is not the average investor, but the one most willing to transact at the prevailing market price. Prices move to equilibrate supply and demand, so whoever is making the last trade effectively determines the price. Their preferences, constraints, and expectations shape stock prices.
2Investment trusts in the UK often trade at discounts and less often at premia to the underlying NAV.
3As at 31 August 2025.
4The MSCI World Index has inclusion criteria that prioritises market capitalisation, liquidity, and float requirements. The S&P 500 is only slightly better – it requires positive reported earnings in the most recent quarter and the sum of the most recent four quarters to be positive.
This is a marketing communication / financial promotion that is intended for information purposes only. Any forecasts, opinions, goals, strategies, outlooks and or estimates and expectations or other non-historical commentary contained herein or expressed in this document are based on current forecasts, opinions and or estimates and expectations only, and are considered “forward looking statements”. Forward-looking statements are subject to risks and uncertainties that may cause actual future results to be different from expectations.
Nothing contained herein is a recommendation or an offer or solicitation for the purchase or sale of any financial instrument. The material is not intended to provide, and should not be relied on for, accounting, legal or tax advice, or investment advice. The content and any data services and information available from public sources used in the creation of this communication are believed to be reliable but no assurances or warranties are given. No responsibility or liability shall be accepted for amending, correcting, or updating any information contained herein.
Please be aware that past performance should not be seen as an indication of future performance. The value of any investments and or financial instruments included in this website and the income derived from them may fluctuate and investors may not receive back the amount originally invested. In addition, currency movements may also cause the value of investments to rise or fall.
This content is not intended for use by U.S. Persons. It may be used by branches or agencies of banks or insurance companies organised and/or regulated under U.S. federal or state law, acting on behalf of or distributing to non-U.S. Persons. This material must not be further distributed to clients of such branches or agencies or to the general public.
Get the latest insights & events direct to your inbox
"*" indicates required fields