


Earnings drive share prices. No doubt most investors will have heard some derivative of this investing dictum many times throughout their careers; indeed, these days it’s akin to an immutable truth. However, just because it is considered conventional wisdom does not mean we shouldn’t put the theory under the microscope every now and then to assess whether it retains any meaningful predictive power.
In its most basic form, the value of a stock at any point in time is driven by a mix of a) the future cash flows that it is expected to generate over time, and b) the level of confidence that investors place on its ability to generate those cash flows. In essence, the former is based on fundamentals and the latter on the investment environment.
At Seilern, it has been our view for over 30 years that for us, as bottom-up investors, it is significantly easier to assess the fundamentals of a business (things like its growth prospects, the strength and durability of its competitive advantage, and whether its capital structure will improve its probability of success) versus having to make educated guesses regarding the direction of the future external investment environment. Indeed, even the experts struggle with the latter – think of the old joke about economists predicting nine of the past five recessions.
When it comes to applying this theory to quality growth companies, we believe that fundamentals become even more important, especially when looking out over the long term. Quality growth companies have strong secular tailwinds, which means that they are less dependent on the fortunes of the global economy for their earnings growth. External factors such as consumer sentiment, business confidence, monetary and fiscal policies, and, of late, the sheer volume of liquidity that has been pumped into the global economy, have clearly had a large bearing on the value of all financial assets. These factors, however, have little bearing on a quality growth company’s ability to continue growing its earnings over the long term.
So that’s the theory, but what does the data tell us? Below we have plotted the S&P 500 Index against its earnings per share as far back as we could find reliable data (1954, or 69 years). What we can deduce is that, over the past 69 years, the proportion of the index which has been explained by earnings (otherwise known as R²) is 0.93; this is high1.
Figure 1: S&P 500 Index vs Earnings Per Share (1954 to 2022*)
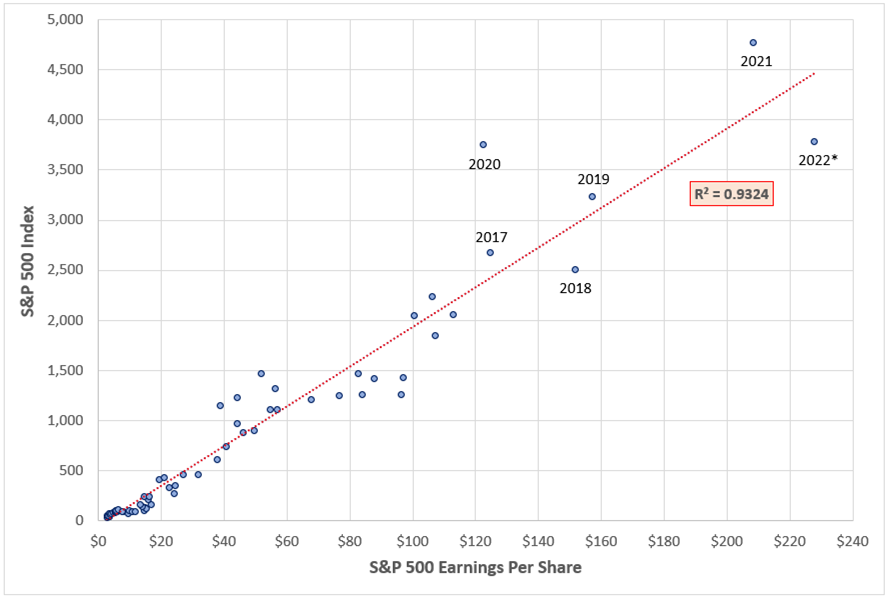
Another way of demonstrating the causal link is by comparing the actual growth rate of the S&P 500 against its earnings. Over this period, the S&P 500 has grown at a compound annual rate of 7.1 per cent, which is not too far ahead of its long-term earnings growth rate of 6.7 per cent .
Unfortunately, though, the chart doesn’t really give us the full picture. The reality is that, since the Global Financial Crisis of 2008/09, this dependency has started to break down due to the ultra-accommodative global monetary and fiscal environment. Falling discount rates have supported highly indebted companies and resulted in an increased level of investor confidence that longer dated cashflows will be achieved.
By the end of 2021, the value of the S&P 500 far exceeded its long-term earnings growth potential to the extent that there was no longer a meaningful explanatory power between fundamentals and share prices. For the 10-year period to 2021, the 8.0 per cent compound annual growth rate of S&P 500 earnings was dwarfed by the 14.4 per cent rise in its value. This was likely driven by the tsunami of liquidity that entered the system, which drove a large multiple expansion and a dislocation from fundamentals. However, when you consider that interest rates were effectively zero per cent throughout 2021, and there was little prediction that either rates or inflation were going to materially rise, it could have been argued at the time that the stock market was fairly valued due to the specific investment environment prevailing at the time.
Below, we have split the above data into discrete time periods. The R² over the past 10 years falls to 0.67, which is still representative of a positive relationship, albeit much weaker than before. If we focus in on the past five years, however, the R² falls to 0.37. While we recognise that five data points do not lead to a meaningful sample size, in three of the five years, earnings and prices have uncharacteristically moved in the opposite directions (see below). This is why one should focus on a longer timeframe when assessing this relationship.
• 2018: EPS grew +22 per cent, yet the S&P 500 finished the year down -6 per cent.
• 2020: EPS fell -22 per cent, yet the S&P 500 finished the year up +16 per cent.
• 2022e: EPS forecast to grow +9 per cent, yet the S&P 500 has fallen -21 per cent.
Figure 2: Breakdown of S&P 500 Index and Earnings Growth vs the Seilern Universe
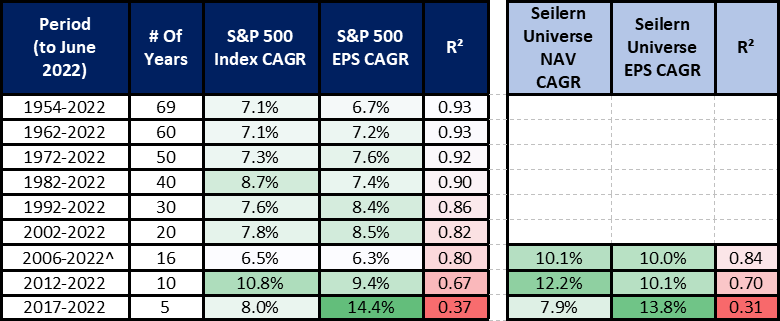
^ Daily performance data for the Seilern Universe started being recorded from 2006
How have these dynamics played out across the quality growth companies within the Seilern Universe? From December 2006 to June 2022, the value of the Universe (as measured by its theoretical net asset value) has risen at a compound annual growth rate of 10.1 per cent. While this has been an excellent level of compounding, the most meaningful driver of this performance has been its earnings growth rate of 10.0 per cent. In other words, over the past 16 years, earnings have essentially driven all of the value of our companies, despite the many changes we have seen over that time in the investment environment (Focusing On The Fundamentals).
It is also interesting to note that the R² for the Seilern Universe over this 16-year period has been 0.84, which is higher than the R² of 0.80 for the S&P 500. The insight here is that, while earnings drive share prices in a broad sense, the explanatory power appears to be stronger for quality growth businesses due to the stability and predictability of their earnings growth. This has been our long-held belief.
The other important point to make on this topic revolves around earnings stability. While it’s one thing to say that earnings drive share prices, the variability in those earnings is a critical ingredient to add to the mix. If you can invest in a company with a strong and durable level of earnings growth, then this business should naturally demand a higher valuation (Don’t Be Fooled By The P/E Ratio).
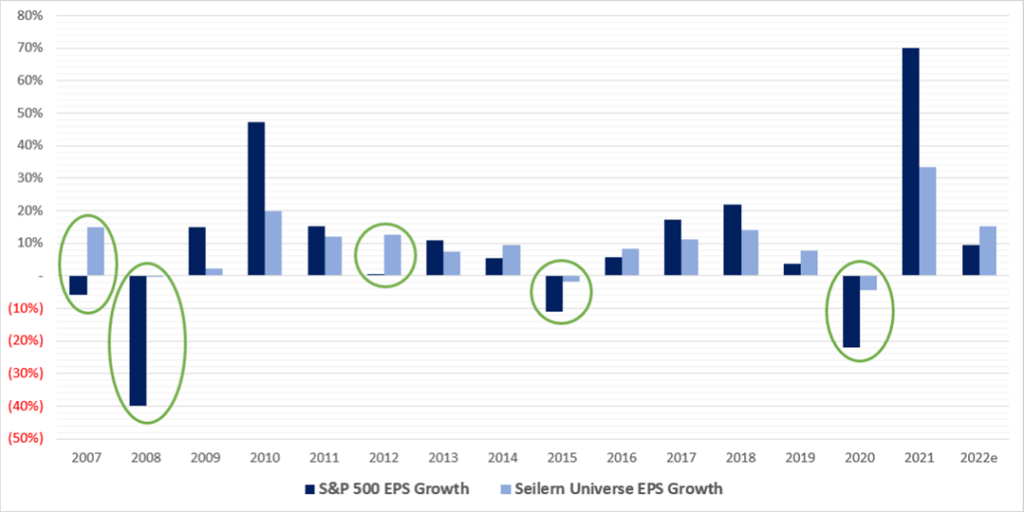
We can see this below, where we have charted the earnings growth of the Seilern Universe versus the S&P 500 since 2007. The key takeaway here is that the Universe companies have been able to protect investors on the downside in terms of the fundamentals (A Fund For All Seasons). When the market has seen flat or falling levels of earnings growth, the Universe companies have been extremely resilient. Indeed, the standard deviation2 of the Universe’s earnings growth of 8.9 per cent is materially lower than 24.5 per cent for the market. This is important to bear in mind when investment discussions start mentioning the word ‘recession’.
Figure 3: Downside protection – Earnings growth of the S&P 500 vs the Seilern Universe
In summary, so far in 2022, there has been a marked shift in the investment environment, one which is being driven by a global upward re-pricing of the cost of money and which is, in turn, leading to factor rotations into value stocks over both quality and growth stocks (Buy High, Sell Low). Add to this a worsening liquidity backdrop, followed by increasing fears of a global recession, and one could understand why we have witnessed one of the sharpest multiple compressions in history (Reassuringly Expensive).
It is our view that the market has simply not had the time to separate the wheat (quality growth businesses with pricing power, high margins, high return on capital and low debt) from the chaff (unprofitable growth businesses and quality business without the ability to effectively combat rising inflation). This has naturally led to a sharp contraction of the premium for the Seilern Universe. Reassuringly, the share price growth of our companies since 2007 is now back in line with its long-term earnings growth, which we deem to be a healthy re-adjustment of the investment environment.
Crucially, the point which gives us the strongest level of confidence for future returns is that the earnings growth expectations of our companies have, so far, remained stable. While share prices may have fallen a lot this year, the prospective returns of each of the Seilern Funds have risen quite dramatically. This means that the probability that our companies will be able to drive strong share price returns in the future has improved. While these forecasts do not incorporate expectations of possible future recessions, ultimately, the strength and durability of earnings growth really do drive share prices.
* S&P 500 Index on 30 June 2022 and full-year EPS estimate on 30 June 2022
1R² describes how much a change of one dependent variable (S&P 500 Price) can be explained by a change in an independent variable (S&P 500 EPS). The closer to 1.0, the greater the explanatory power of the independent variable.
2The measure of dispersion around the mean.
This is a marketing communication / financial promotion that is intended for information purposes only. Any forecasts, opinions, goals, strategies, outlooks and or estimates and expectations or other non-historical commentary contained herein or expressed in this document are based on current forecasts, opinions and or estimates and expectations only, and are considered “forward looking statements”. Forward-looking statements are subject to risks and uncertainties that may cause actual future results to be different from expectations.
Nothing contained herein is a recommendation or an offer or solicitation for the purchase or sale of any financial instrument. The material is not intended to provide, and should not be relied on for, accounting, legal or tax advice, or investment advice. The content and any data services and information available from public sources used in the creation of this communication are believed to be reliable but no assurances or warranties are given. No responsibility or liability shall be accepted for amending, correcting, or updating any information contained herein.
Please be aware that past performance should not be seen as an indication of future performance. The value of any investments and or financial instruments included in this website and the income derived from them may fluctuate and investors may not receive back the amount originally invested. In addition, currency movements may also cause the value of investments to rise or fall.
This content is not intended for use by U.S. Persons. It may be used by branches or agencies of banks or insurance companies organised and/or regulated under U.S. federal or state law, acting on behalf of or distributing to non-U.S. Persons. This material must not be further distributed to clients of such branches or agencies or to the general public.
Get the latest insights & events direct to your inbox
"*" indicates required fields