


In client meetings these days, when the topic invariably turns to stock market valuation, we are increasingly being asked when ‘value’ stocks will start outperforming ‘growth’ stocks, particularly seeing as the former are now looking ‘cheap’. The Price-to-Earnings (P/E) ratio is often the barometer by which this cheapness is assessed, despite the fact that it, in our opinion, is simultaneously the most widely used and misused valuation metric in the investment world. In order to demonstrate this, I would like to pose a hypothetical investment option for the reader:
You have two companies which have the exact same earnings per share (say $1.00), the exact same long-term earnings growth rate (say 6.0%), yet Company A trades on a P/E of 13x and Company B trades on a P/E of 49x. Assuming both also have the exact same cost of capital (say 7.5%), which company offers more ‘value’?
From only this information, an investor relying on conventional wisdom might hastily conclude that, given both companies are growing at the same rate, company A looks more attractive because 13x is ‘cheaper’. This is often accompanied with a statement that the investor will also have ‘downside protection’ with Company A because its valuation isn’t as ‘stretched’ as that for Company B.
The answer? Both Company A and Company B are exactly fairly valued.
Below I will explain why, but it’s worth the reader bearing in mind that the way we have calculated this fair value is based on well-established principals of financial theory, which dictate that the fair value of a company is the sum of its discounted future free cash flows. If we were to simplify this into its most basic form, then the fair value P/E can be expressed as:

Let’s get back to our example. The key variable between Company A and Company B, and which is most often overlooked by investors when doing this simple valuation exercise, is that their Return on Invested Capital (ROIC) is vastly different. Company A is only able to grow its long-term earnings at a ROIC in line with its cost of capital (so 7.5%), yet Company B is able to grow these same earnings at a ROIC of 22.5%. Not coincidentally, Company B’s ROIC is the same as that of the average company within the Seilern Universe.
What investors often fail to understand is that a stock’s fair value P/E ratio already contains the 3 key ingredients that have created it: the long-term earnings growth, the weighted average cost of capital (which can be interchanged with the required return expected by an investor), and the reinvestment rate.
The last of these is lesser studied, however is straight forward. It is simply the level of operating and capital expenditures that a company chooses to reinvest in its own business activities in order to continue growing. An easy way of stating this is:

The flip side to the reinvestment rate coin is the distribution rate. This is simply the proportion of free cash flows that a company is able to distribute to its shareholders (such as dividends and share buybacks) after it has reinvested all the necessary profits to continue growing the business at its targeted earnings growth rate.
So let’s go through a simple example. Company B above has a long-term earnings growth rate of 6.0% and a ROIC of 22.5%. Its reinvestment rate is thus 27%. What this means is that in order for Company B to grow its earnings at 6.0%, it will only have to reinvest $0.27 of its current $1.00 of earnings into next year. Stated differently, if it chose to only re-invest $0.27 of its current $1.00 of earnings into next year, then its 22.5% ROIC dictates that it should achieve a 6.0% earnings growth rate (0.27 x 22.5% = 6.0%).
The remaining 73% is its distribution rate, and can also be described as its ‘excess profits’ (or Free Cash Flow). This is what drives the value of a company over the long-term. Compare this to Company A, which has a reinvestment rate of 80% (6.0% earnings growth / 7.5% ROIC). In order for Company A to grow its earnings at the same 6.0% rate like Company B next year, it would have to reinvest 3x more capital ($0.80 vs $0.27). This demonstrates the power that companies with high ROICs have over their lesser brethren – higher capital efficiency.
Another valuable point worth making regarding the above reinvestment rate formula is that a company’s long-term earnings growth rate cannot exceed its ROIC over the long-term. There are, of course, circumstances when this could be achieved in the short-term (for example, if a company took on a large amount of debt, or decided to liquidate its assets), however, over the long-term this relationship holds. Thus, a company with a 10% ROIC has a long-term earnings growth rate ceiling of 10%. If it wanted to improve this growth rate, then it would have to invest its capital more efficiently and productively (this is known as having ‘positive incremental ROIC’). Unfortunately, many sectors of the economy (such as banking and energy) restrict the ability of its companies to do so given their highly competitive and commodity-linked natures.
Thus, a company operating with a much higher ROIC has the possibility of growing its long-term earnings at that rate. Whether it can actually do so is a completely different argument. Some companies simply cannot re-invest all of their excess profits at once. This may be because their available investment opportunities would dilute their ROICs, or it may simply mean that they prefer to have a more balanced capital allocation framework, incorporating a certain level of shareholder dividends and share buybacks into their modus operandi.
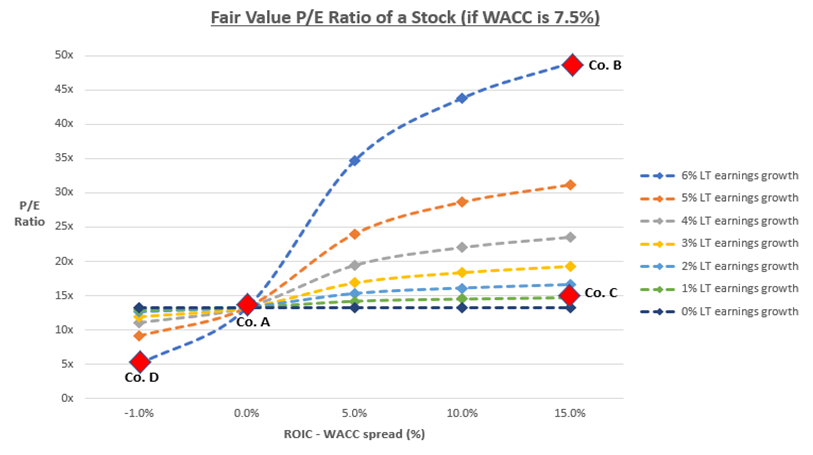
On the next page is a visual demonstration of what we have been discussing above. It plots the fair value P/E ratios for 35 theoretical companies, all with differing levels of long-term earnings growth rates and ROICs. Given each of these companies has an earnings per share of $1.00, the P/E is also technically its $ value. To simplify the analysis further, I have plotted the company’s ‘ROIC – WACC’ spread on the horizontal axis given the key point I’m attempting to highlight is that a company only starts to create meaningful value once it achieves a ROIC well above its cost of capital. This value is subsequently recognised through a higher P/E multiple. All of these companies are exactly fairly valued.
Source: Seilern Investment Management
Above, we can see Company A and Company B, which we’ve previously discussed. There are some quite interesting observations to make from this chart:
- Without a positive spread, no matter how strong a company’s long-term earnings growth rate is, it will still not be able to add excess profits. Its fair value will therefore be limited to a P/E of 13x. Thus, two companies with 6.0% long-term earnings growth and 0% long-term earnings growth respectively, will both have the same value.
- The value of a company only rises significantly when both its spread and its long-term earnings growth rise in tandem. Thus, even a company with a wide spread over its cost of capital will trade at a low valuation if it can only grow its long-term earnings at a low level (e.g. Company C). For each percentage of long-term earnings growth a company can add at this wide spread, its value begins to materially increase (e.g. Company B).
- If a company has a ROIC less than its cost of capital, then the higher its earnings growth rate, the lower its value. This means that the faster a company tries to grow, the more value it will destroy. This can clearly be seen above via Company D; despite this company having the strongest level of earnings growth (6.0%), its negative spread of -1.0% results in it only having a fair value of 5x P/E.
Whether a company actually trades at its fair value P/E is another topic entirely, and one with a multitude of variables. At its most basic level though, the premium or discount that a stock’s actual P/E will trade to its fair value P/E is based on investors’ expectations of what our previously mentioned 3 key ingredients will do in the future. For example, if Company D were trading on a P/E higher than it its fair value, then either the stock is significantly overvalued, or the market is expecting its fundamentals to improve. This could mean either a higher than expected long-term earnings growth rate, a lower cost of capital, or maybe a higher ROIC (which will drive the company’s reinvestment rate lower). Or perhaps a mix of all three.
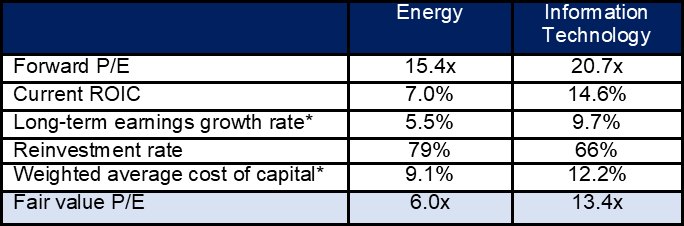
An astute investor should therefore be looking at these underlying assumptions, and assessing their individual merits. A great real-life example are companies in the Energy sector. At present, the MSCI World Energy Index is trading on a forward P/E of 15.4x. Should we conclude that this sector is cheap, especially compared to, say, the MSCI World Information Technology Index, which is trading on a forward P/E of 20.7x? The current fundamentals of both sectors are below:
Source: Bloomberg; FactSet (November 2019)
*Annualised historic data since 1990
Using our previously discussed fair valuation methodology, an investor can now see that the Energy sector should only be valued at a 6.0x P/E, and the Information Technology sector at a 13.4x P/E. Superficially this tells us that both sectors appear expensive at present because their fair value P/Es are lower than their actual P/Es. This, however, is only part of the story. In order to understand whether this analysis is correct, an investor should interpret what the actual P/Es are telling them, and whether the market’s assumptions for why these premiums to fair values are what they are.
For the Energy sector to deserve a valuation of 15.4x P/E, it would either have to expand its current ROIC by ~75% to 12.3%, or lower its cost of capital by ~25% to 6.9%. The former is arguably very difficult to achieve, and the latter implies that either interest rates should be lower or that the business take on more debt (which increases its risk profile, thus lowering its quality in our eyes). Why can’t the company simply increase its long-term earnings growth you might ask? Well, remember our reinvestment rate formula previously discussed; the maximum a company can grow its long-term earnings is at its ROIC. Therefore, the Energy sector should not be able to exceed a growth rate of 7.0% for very long, which is still not enough for it to achieve its 15.4x P/E. So the conclusion perhaps is that this fair value appears to be, well, reasonably fair.
For the Information Technology sector, the implications from the fair value P/E analysis result in a mix of the following market-expected changes to our three key ingredients:
- That ROIC will increase over time to 20.7%; or
- That the long-term earnings growth rate will increase to 11.0%; or
- That the cost of capital will decrease to 11.3%.
It appears that the Information Technology sector might be more deserving of its premium rating. Why? Not because its ROIC will likely increase to 20.7% (although this could certainly happen), but rather that it isn’t such a stretch for it to achieve an 11.0% long-term earnings growth rate from its current 9.7% starting position. It can only achieve this because the ceiling of its long-term earnings growth rate, its current ROIC of 14.6%, is more than double that of the Energy Sector’s 7.0%. Compared to the Energy sector, at least the Information Technology sector has the possibility of growing its earnings at its higher ROIC ceiling.
In the end, determining any of these expected market changes is a subjective task. The individual investor needs to question whether the implied changes in the market’s assumptions are in-line with their own expectations. Only then can a reasonable conclusion be made after the first simplistic sighting of a P/E ratio.
In conclusion, whilst the perceived simplicity of the P/E multiple is alluring to investors, it should now be clear that relative valuation ratios on their own do not tell us whether one company is ‘cheaper’ than another. In fact, they can often mislead investors into believing that they are getting a ‘good deal’. The key to understanding the intricate pieces of information which are neatly wrapped up in a P/E ratio is to spend time analysing a company’s Return on Invested Capital, which is how we begin to assess quality growth businesses at Seilern. The higher a company’s ROIC, the greater its possibility of growing its earnings at a more attractive rate over the long-term. This, rightly so, should lead to a higher, but not necessarily more ‘expensive’, valuation.
^ We note that this is a simplistic view of what can be quite a complex calculation, but one which helps illustrate the theory nonetheless. The additional topics not discussed here include the interplay between capital expenditures and depreciation/amortisation rates, the effects of changing debt levels, and the impacts from changes to the capital structure of a company from merger and acquisition activity.
M Lo Blanco
03 December 2019
Any forecasts, opinions, goals, strategies, outlooks and or estimates and expectations or other non-historical commentary contained herein or expressed in this document are based on current forecasts, opinions and or estimates and expectations only, and are considered “forward looking statements”. Forward-looking statements are subject to risks and uncertainties that may cause actual future results to be different from expectations. Nothing in this newsletter is a recommendation for a particular stock. The views, forecasts, opinions and or estimates and expectations expressed in this document are a reflection of Seilern Investment Management Ltd’s best judgment as of the date of this communication’s publication, and are subject to change. No responsibility or liability shall be accepted for amending, correcting, or updating any information or forecasts, opinions and or estimates and expectations contained herein.
Please be aware that past performance should not be seen as an indication of future performance. Any financial instrument included in this website could be considered high risk and investors may not get back all of their original investment. The value of any investments and or financial instruments included in this website and the income derived from them may fluctuate and you may not receive back the amount originally invested. In addition stock market fluctuations and currency movements may also affect the value of investments.
Get the latest insights & events direct to your inbox
"*" indicates required fields