






If you’ve ever succumbed to the temptation of the flashing lights of a casino, you may have witnessed the strange goings on around the roulette table. Here, despite the fact that every time the wheel spins, you face the same likelihood of the ball landing on any of the 37 slots, you will nonetheless find all sorts of strange and sophisticated betting strategies. Screens helpfully point you towards “hot streaks” while successful players, amassing burgeoning piles of chips, attract onlookers who start to follow them in. This is, of course, all entirely irrational for a game based on pure luck, but something within our psychology leads most people to assume that if something has worked in the past, it will continue into the future.
Away from casinos, the idea of momentum is not always so irrational. In a football match, a study has shown that a team who has already scored two goals will be more likely to score a third. Not because of some mystical force, but because the conditions that produced the first two goals, such as an inferior opposition, may still exist, and because the new conditions (being 2-0 up) may allow the leading team to play with more confidence and take more risks. The question for investors is which of these two situations are they in; are the conditions genuinely favourable, or are they simply following a streak?
With the S&P 500 rallying 20 per cent in April and May the topic of momentum is everywhere. But what does it actually mean for investors? The phenomenon we are seeing at the moment is morphing beyond the traditional market sense of momentum into a concentrated bet on “all things AI”. How should investors view this emerging bubble and what can they do to defend themselves in the event that it pops?
What is momentum?
Given the mathematical nature of markets, you might assume that the word momentum comes from physics. In mechanics, momentum is mass multiplied by velocity. The heavier and faster an object, the harder it is to stop. However unlike in physics, where friction gradually slows a moving object to rest, in markets, the equivalent process, known as a momentum unwind, more often resembles a car hitting a wall, or more accurately, an elastic band snapping back violently.
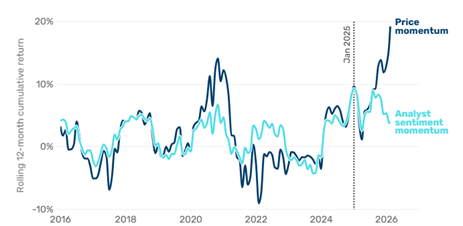
In its formal definition as an investment factor, momentum merely captures the best-performing stocks over a trailing period, most commonly either 6 or 12 months. There can be many reasons why a particular stock is among the best performers, but in normal circumstances, companies with the strongest earnings upgrades, known as earnings momentum, also tend to have the strongest price momentum. As shown in the study from MAN group below, in the decade up to January 2025, price momentum and earnings momentum moved in lock step. All this is to say that when a stock rises, there is usually a fundamental reason behind it.1
What is happening in markets right now?
Over the past 20 years, buying what has already gone up has been a winning strategy, with any pullbacks in indices proving excellent buying opportunities, conditioning the prevailing Buy-The-Dip mentality and reinforcing momentum as the dominant force. In the past decade, a series of overlapping thematic trades have propelled indices higher: from long-duration growth and quality stocks, through ESG and COVID beneficiaries to the Magnificent 7.
Although the rate hikes of 2022 interrupted this upward march, the release of ChatGPT signalled the handing over of the baton to the latest and largest thematic trade of all. Led at first by Nvidia, the AI trade has broadened out across semiconductors, other areas of tech and most recently the industrials and utilities supplying the power and physical infrastructure behind the largest capex build out since the railways in the 19th Century.2 Since the US-Iran ceasefire at the end of March, the rally has intensified: the S&P 500 Momentum Index3 surged 31.7per cent in April and May, the largest two-month move in its 32-year history; the PHLX Semiconductor index is up 89 per cent year-to-date; and tech stocks have generated 85 per cent of S&P 500 gains.
Earlier this year, however, momentum became dislocated from its earnings counterpart. Investors poured into AI-related stocks regardless of whether the companies were seeing earnings upgrades. Man Numeric, in a study published in February this year, estimated that this industry crowding contributed more to price momentum than at any point in the 11-year history of their analysis. Earnings revisions have since resumed their upwards march, but price momentum has surged still further ahead. In other words, what people are calling the momentum trade is, in practice, the same as the AI trade, with markets going all in on the same bet.
Figure 1: A decade of correlation is now broken
The $700bn (and rising) question?
We know that this outperformance of momentum and AI can’t run forever, but we unfortunately do not know when and how it will come to an end. Some are trying to map the current rally to the late stages of the dot-com boom, pointing out that in July 1998, having already doubled over the prior three years and after an “inconsequential” -30 per cent pullback, the Nasdaq trebled over the ensuing 18 months. The implication being that there is much further to run. But arguments which lean on the force of recent trends and draw comfort from historical parallels takes you into the world of speculation, and by following them you are doing little more than the hangers on at the roulette table.
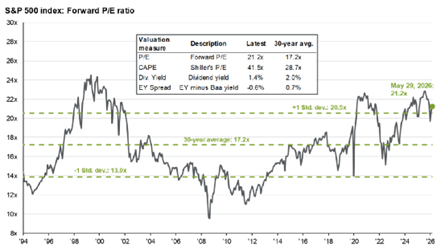
A bull may respond that the comparison to 2000 is in fact a fair one, but for different reasons. Just as the internet was about to produce revolutionary change at the turn of the century, so AI is poised to do the same, and on a potentially larger scale. The spending plans of the hyperscalers, now approaching $700 billion for this year alone, provide tangible evidence that this is more than hype. What’s more, valuations have not yet reached previous peaks, while the current market structure and the relentless wall of passive flows could arguably justify higher peak multiples than we have seen before.
It is hard to argue with the extent of the revolutionary change, and we cannot disagree that the various momentum amplifiers within the market structure may propel indices higher. We would, however, disagree on valuations. The forward P/E of the S&P 500 at 21.8x may appear short of previous peaks, but it is still well ahead of recent and long-term averages. More importantly, this is before factoring in that earnings estimates have been surging too. In the past six months, 2027 EPS estimates for the S&P 500 have risen by 11.6 per cent, so that companies in the index are expected to grow earnings in aggregate by 15 per cent in 2027, after a staggering 26 per cent in 2026. For stocks in the semiconductor index, estimates have risen 64 per cent over the same period. We may not yet be at peak valuations, but earnings are certainly getting close.
Figure 2: S&P 500 forward P/E ratio 1994-2026
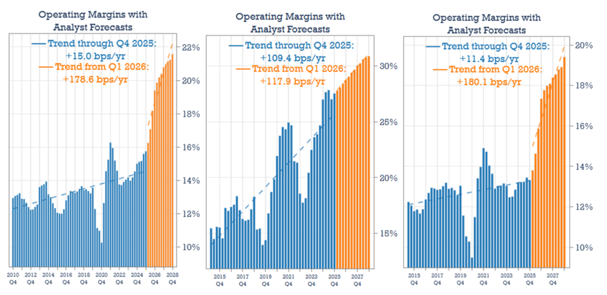
Analysis from Hussman Strategic Advisors has shown what these surging estimates imply for operating margins. From a 15-year peak of 16 per cent, aggregate margins of S&P 500 companies are expected to rise almost 600 basis points to 22 per cent by the end of 2028. The increase attributable to the Magnificent 7, while aggressive, would at least be roughly in line with the trend of the past decade, and is arguably achievable if AI’s productivity promises come through. For the other 493 companies, however, the implication would be truly remarkable, perhaps even unbelievable.
For these companies, the trend shifts from a miserly 11.4 basis points per year to a gargantuan 180 basis points per year, with margins stepping up from 14 per cent to 20 per cent, completely at odds with long-term trends. Such an increase is not impossible, though it feels extremely unlikely. And even if it were achieved, we find it even harder to believe that companies would be able to sustain such high margins. If AI really does deliver these productivity gains for one company, it will presumably do so for its competitors too, and the competitive forces that follow should push margins back down. In the context of an earnings base that is already well ahead of anything seen in the past, valuations look even more treacherous than they first appear.
Figure 3: Historic and forecast margins of S&P500 (LHS), Magnificent 7 (Centre) and S&P493 (RHS) Companies
Rushing for the exits
For those not in the AI maximalist camp, the market running near all-time high valuations, on optimistic and potentially cyclically peak earnings, should be some cause for concern, and the only question left may be when to get out. Unfortunately, there is no bell that rings at the top of the market. And even if there were, you’d need to consider how many others were queueing up to get out at precisely that moment. While we have shown that the rise in momentum points to growing concentration in the same AI trade, the reality may be even more extreme. Analysis from Matt King at Satori Insights shows that even apparently diversified hedge fund strategies may be hiding in the same exposures.
Hedge fund returns appear to have very little in common with the broader market. The average fund has a beta of 0.1, meaning it moves only a tenth as much as the index. However, almost all of those small movements are currently in the same direction as the market, as measured by an R-squared of 0.7 to 1. The reason is that different funds hedge their portfolios in different ways, each running its own distinct short book, which dampens the size of returns. Yet the long books have all converged on the same cluster of stocks. Thus, in a reversal, funds that were supposed to be diversifiers do exactly the opposite as they become forced sellers of the same stocks at the same time.
The problem extends well beyond hedge funds. An asset allocator holding a US growth fund, an emerging market tracker and a sustainability fund might reasonably believe they are diversified. But when AI linked stocks account for 45 per cent of the S&P 500, when TSMC, Samsung and Hynix are 27 per cent of the MSCI Emerging Markets index, and NVIDIA has found its way into all sorts of Quality and sustainable funds, the underlying earnings driver ends up being the same. What has looked decorrelated on the way up may prove to have a correlation of one on the way down. When you add in US retail investors, whose equity allocation of 45 per cent is at record highs, and hedge fund gross leverage of 3.2x,4 well ahead of recent history, the exit could look more like a stampede than an orderly departure.
From MOMO to FOMO
The momentum machine shows no sign of stopping. There is plenty of fuel on which this momentum fire can feed on in the weeks and months ahead. Flows, spiralling capital expenditure guidance from the hyperscalers, and surging revenues from infrastructure providers on capex that has already been laid down. And, of course, the circus that is going to surround the three mega IPOs that we are about to see. At $75bn, SpaceX alone is going to be raising more than double the largest ever offering, with Anthropic and OpenAI’s likely to be of a similar scale.5 The media attention and ebullient statements from executives and observers is going to take FOMO to unbearable levels. The flip side, of course, is that this record level of issuance will be a significant drain on liquidity.
Figure 4: In addition to shares floated at IPO, expiring lockups can increase the equity supply
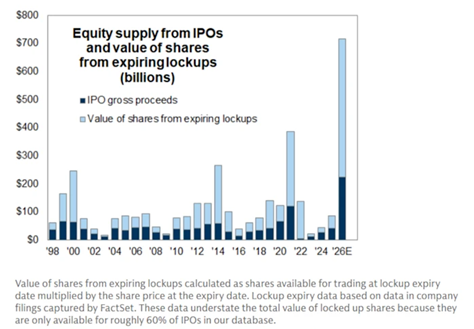
Source: Bloomberg, FactSet, Goldman Sachs Global Investment Research
In the face of such extreme metrics and statements, one needs to remain steadfast. Conventional diversification may not be enough. As we have shown, portfolios that look diversified across regions, styles and strategies may in practice be driven by the same underlying trade. For us, genuine diversification means owning businesses whose predictable earnings growth comes from their own competitive position, independent of the AI cycle.
This is easier said than done. The pressure to keep up with stellar returns from those who have leaned into the momentum will be high, regardless of performance up to this point. But that same decorrelation, the price being paid in underperformance today, is what should protect a portfolio when the momentum inevitably unwinds.
1 Man Numeric, the quantitative arm of Man Group, has tracked this relationship and found a historical correlation of approximately 0.86 between the two.
2 This is in nominal terms. Relative to GDP, current capex is equivalent to c 1.7 per cent of GDP, vs 6 per cent at the time of the railways.
3 An index maintained by S&P that tracks the performance of the highest-momentum stocks within the S&P 500.
4 https://www.goldmansachs.com/insights/articles/how-hedge-funds-are-trading-semiconductor-stocks
5 SpaceX is targeting a valuation of $1.75tn and is offering $75bn. Anthropic and Open AI’s offering sizes are unknown at this stage, but the valuation of both at listing are expected to be in excess of $1tn.
This is a marketing communication / financial promotion that is intended for information purposes only. Any forecasts, opinions, goals, strategies, outlooks and or estimates and expectations or other non-historical commentary contained herein or expressed in this document are based on current forecasts, opinions and or estimates and expectations only, and are considered “forward looking statements”. Forward-looking statements are subject to risks and uncertainties that may cause actual future results to be different from expectations.
Nothing contained herein is a recommendation or an offer or solicitation for the purchase or sale of any financial instrument. The material is not intended to provide, and should not be relied on for, accounting, legal or tax advice, or investment advice. The content and any data services and information available from public sources used in the creation of this communication are believed to be reliable but no assurances or warranties are given. No responsibility or liability shall be accepted for amending, correcting, or updating any information contained herein.
Please be aware that past performance should not be seen as an indication of future performance. The value of any investments and or financial instruments included in this website and the income derived from them may fluctuate and investors may not receive back the amount originally invested. In addition, currency movements may also cause the value of investments to rise or fall.
This content is not intended for use by U.S. Persons. It may be used by branches or agencies of banks or insurance companies organised and/or regulated under U.S. federal or state law, acting on behalf of or distributing to non-U.S. Persons. This material must not be further distributed to clients of such branches or agencies or to the general public.
Get the latest insights & events direct to your inbox
"*" indicates required fields