


We are often asked by clients why we have a large exposure to the ‘health care’ sector within our Seilern Universe and across our funds and whether this poses a risk. Our answer is that the concept of risk, and ways to diversify it when constructing portfolios, has many different meanings for those in the investment community. Top-down allocators argue that managing sector exposures provides sufficient diversification to lower risk, which they equate to volatility. At Seilern, we see risk not as volatility, but as the probability that our companies fail to generate the stream of cashflows that we forecast and that we will therefore incur a permanent loss of capital. We manage this risk by excluding ‘riskier’ companies from the outset, and then by knowing our invested companies in as much detail as possible, as my colleague Quentin explored in his recent newsletter (There’s More To Risk, Than Vol and The VIX). In this newsletter I will explain how we then manage this risk at a portfolio level, by managing what we call ‘bulk-risks’ and demonstrate why this is a more sensible approach than trying to manage top-down sector exposures.
When it comes to constructing our portfolios, our belief that earnings drive share prices means that ensuring these earnings come from as diverse a set of sources as possible, is essential. The point being that in the event that one of these secular sources is eroded, the earnings, and therefore performance of the funds are not overly affected. We do this by focusing on the underlying business models and the long-term secular growth drivers that each stock is exposed to and diversifying our portfolios based on the ‘bulk-risk’ weighting to these different growth drivers. For example, we look at how much exposure a portfolio might have to the Chinese luxury consumer or to value-based health care reform in the US.
In order to do this, we must have a deep knowledge of each of the stocks in our portfolios. We achieve this firstly by concentrating on a few names to analyse in greater depth which is why our portfolios consist of only 17-25 stocks. We also achieve this by continually assessing and monitoring these names over long periods to build our collective knowledge. This means that we can then understand, intimately, what should drive each stock, how it should behave in different market environments and hence how our portfolios should behave. By limiting our exposure to each particular growth driver, business model or specific end-market, we limit any negative return should something impact any of these areas. Thus, even if the Chinese luxury consumer starts spending less, or the US health care system faces reform, the overall impact on the portfolio is limited.
In contrast, a top-down sector allocation strategy aims to diversify risk by ensuring a balance of different sector exposures. However, it requires not only perfect foresight to predict exactly when economic circumstances might change, a task even the best economists will admit is impossible, but also requires an accurate classification of stocks into their respective sectors and industries. The Global Industry Classification Standard (‘GICS’), developed by MSCI and Standard & Poor’s, is the most widely used industry framework for sector-based portfolio management, and yet in our opinion is poorly equipped to actually diversify risk.
Within this framework companies are grouped into a multi-tiered hierarchical industry classification system according to their principal business activity, with revenues the key determining factor. The drawback here is that each and every company has to be shoehorned into an industry, and a sector, in order to be used in a sector-allocation framework. So what isn’t captured is the totality of a company’s exposure, the nuances of its business model and the long-term secular growth drivers that may be spread across different industries and sectors. Hence an investor that is investing in a stock partly due to its industry or sector classification will be disadvantaged unless they take the time to research and understand the facets of the business in detail.
To illustrate this further, let us explore the ‘Health Care’ sector as defined by the GICS system. As mentioned previously, this is the largest sector allocation across our funds. Importantly, this is a consequence of our deep bottom-up research rather than a top-down sector allocation decision. Furthermore, although all these companies are classified as ‘health care’ they all have different growth drivers and risks, meaning the earnings of these companies are a lot more diversified than this blunt labelling suggests.
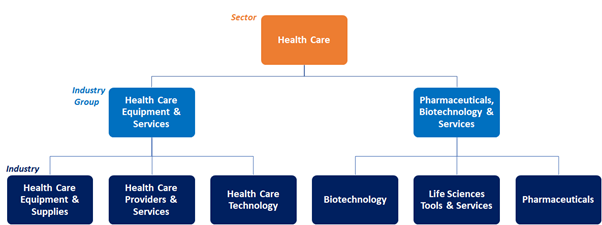
According to the GICS framework, the health care sector is comprised of two industry groups and six industries beneath this, as shown in the figure below. What is key here is that companies within each of these six industries can have markedly different growth drivers and business models. Let us take the examples of IDEXX Laboratories and EssilorLuxottica, which are both held in our Seilern Universe. Both are classified in the Health Care sector, in the same industry group, “Health Care Equipment & Services” and the same industry, “Health Care Equipment & Supplies”.
Figure 1: The health care sector according to the GICS framework
IDEXX is the global leader in companion animal diagnostic tests and services. It provides the veterinary industry with the tools to help treat animals effectively, diagnose illnesses and to raise the standard of care. The company’s long-term growth drivers are linked to the increasing rates of pet ownership and the ‘humanisation’ of pets whereby pet-owners (or “pet-parents”) increasingly see their pets like their children. This results in them spending more of their disposable income on their pets, which includes greater spending on veterinary care and on things like preventative diagnostic testing, both of which benefit IDEXX.
EssilorLuxottica on the other hand, is the global leader in the eyewear industry. It designs, manufactures, distributes and retails corrective prescription lenses, spectacle frames and sunglasses. One of its main long-term growth drivers is the increasing prevalence of myopia, or short-sightedness, across all ages in part due to prolonged exposure to screens such as phone and tablets. Myopia affects around 30 per cent of the global population at present but this is expected to reach over 50 per cent by 2050.[1] In addition, emerging markets, where rising wealth combined with a large pool of people with unaddressed visual issues, are also a key driver of long-term growth.
The different growth drivers also mean the risks to each of these companies are also vastly different. For IDEXX, the risk to its earnings would be if the demand for animal health care was to falter perhaps from a breaking of the bond between humans and pets, whereas for EssilorLuxottica it would be if the trend of increasing rates of myopia starts to reverse. So, if one were to be affected and the share price suffer, it would be highly unlikely that the other stock would also see its share price affected. In short, and to use the language of the quantitative risk manager, their underlying risks are de-correlated.
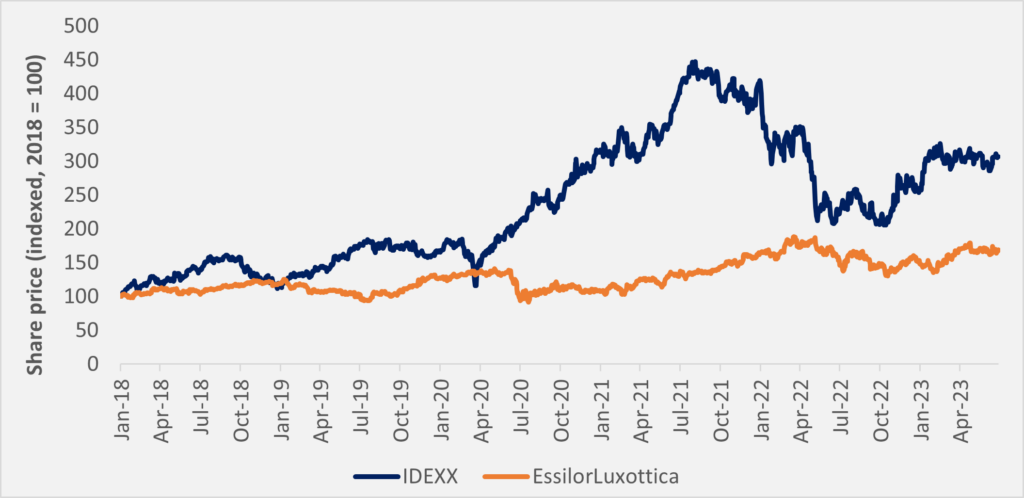
Another way of demonstrating the differences between these two names is to compare their share price performance. If we look at the chart below, on a five-year basis the correlation coefficient (a statistical measure which expresses the extent to which the two variables are linearly related) is just 53 per cent. This is a seemingly low figure for two companies who are supposedly operating in the same industry and hence whose share price performance, in theory, should match closely for those who opt to use a top-down sector-allocation portfolio strategy.
Figure 2: IDEXX and EssilorLuxottica 5-year share price performance (indexed to 2018)
Conversely, companies that fall within the ‘health care’ sector but in different industries can still see their share prices being closely correlated. For example, West Pharmaceutical Services which manufactures low-cost rubber components used in drug delivery services (e.g. rubber stoppers and seals in vials and syringes), falls under the ‘Life Sciences Tools and Services’ industry according to the GICS framework. As such, one would expect a low correlation between its share price and IDEXX which operates in a completely different industry. However, and rather unintuitively, the correlation coefficient leaps to 95 per cent when we look at their share price trajectory over the past five years. This is despite the fact that West’s growth drivers and risks are completely different to IDEXX’s.
These are just a few examples that illustrate why a top-down sector allocation framework is not a true reflection of the concentration of risk within a portfolio. What is a true reflection is how closely correlated the earnings of the companies within the portfolios are. This approach can only be implemented by analysing each business model in detail and managing a portfolio through a bulk-risk lens rather than a top-down sector approach. This is the approach that we have taken at Seilern throughout our history; given the intensity of our research process and our focus on a concentrated list of stocks, this allows us to gain a deep understanding of each company’s business models and therefore the risks that they pose within a portfolio.
1Based on research from the International Myopia Institute (IMI).
This is a marketing communication / financial promotion that is intended for information purposes only. Any forecasts, opinions, goals, strategies, outlooks and or estimates and expectations or other non-historical commentary contained herein or expressed in this document are based on current forecasts, opinions and or estimates and expectations only, and are considered “forward looking statements”. Forward-looking statements are subject to risks and uncertainties that may cause actual future results to be different from expectations.
Nothing contained herein is a recommendation or an offer or solicitation for the purchase or sale of any financial instrument. The material is not intended to provide, and should not be relied on for, accounting, legal or tax advice, or investment advice. The content and any data services and information available from public sources used in the creation of this communication are believed to be reliable but no assurances or warranties are given. No responsibility or liability shall be accepted for amending, correcting, or updating any information contained herein.
Please be aware that past performance should not be seen as an indication of future performance. The value of any investments and or financial instruments included in this website and the income derived from them may fluctuate and investors may not receive back the amount originally invested. In addition, currency movements may also cause the value of investments to rise or fall.
This content is not intended for use by U.S. Persons. It may be used by branches or agencies of banks or insurance companies organised and/or regulated under U.S. federal or state law, acting on behalf of or distributing to non-U.S. Persons. This material must not be further distributed to clients of such branches or agencies or to the general public.
Get the latest insights & events direct to your inbox
"*" indicates required fields