


This month we continue with our series on Interest Rates and Inflation. The first newslet-ter in March discussed the threat of rising interest rates on Quality Growth companies, and how this has driven the current cyclical rotation in the equity market (Interest rates in the time of Covid). This was followed by a discussion in the April quarterly webcast about the valuation implications on Quality Growth companies from a higher interest rate and inflation world (Link). Last month, we expanded on the key topic of pricing power, walking through why it is of critical importance in the face of a potentially changing inflationary landscape (Inflation Series: Pricing Power).
In this month’s newsletter, we will be addressing the input cost side of the equation. If interest rates and inflation start to rise sharply, what could this do to the margins of Quality Growth companies? Do they have ample tools at their disposal to offset, or even improve margins in such an environment? And how much could this slow down their appetite for growth? This newsletter will demonstrate how a company with high (starting) margins and strong (incremental) operating leverage is further able to defend itself against input cost inflation.
One of Seilern’s Ten Golden Rules is to invest in companies with a scalable business model. In our eyes, scalability means that while a company grows its sales, it also has the potential to incrementally improve its margins over time. The relationship between sales growth and changes in margins is known as operating leverage and can be further described as falling between a range from high to low.
High operating leverage occurs when a larger proportion of a company’s cost base is fixed (e.g., software companies that have already expensed a large amount of their product development and marketing costs). Meanwhile, low operating leverage occurs when the cost base is more variable in nature (e.g., many discretionary retailers and consulting firms that rely on a great deal of labour to generate sales). A rising level of inflation will usually result in a broad increase to a company’s operating costs, but not all costs will be affected in the same way.
Below, we have attempted to graphically represent the relationship between sales growth and operating leverage during a rising interest rate environment caused by rising inflation. The first element of the equation is sales growth, reinforced by pricing power. The higher your pricing power, the higher the durability of your sales growth. All else equal, this will increase your chances of being on the winning side once the second element, operating leverage, comes into play.
The effects of both high and low operating leverage can also be significantly amplified by a company’s level of sales growth. A positive level of sales growth mixed with high operating leverage will have the most desirable outcome for the long-term development of a company’s margins, assuming both can be sustained. If sales growth cannot be sustained at a reasonable rate, the company will eventually fall into some form of financial hardship, typically resulting in the need to raise capital in less-than-desirable ways. A company with low levels of operating leverage can still maintain or expand its margins if inflation is rising, but only if it has strong pricing power.
Table 1: Long-term effects on operating margins from rising inflation
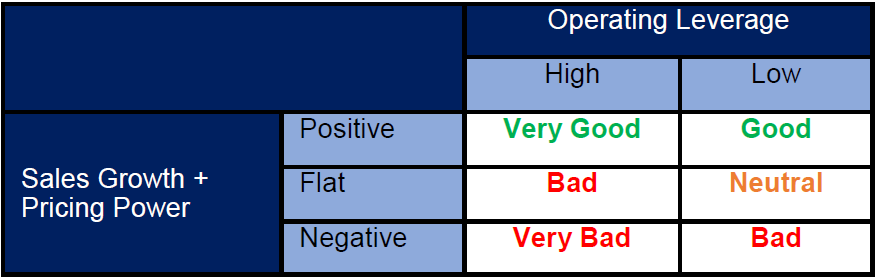
Source: Seilern Investment Management, 2021
While pricing power is undeniably the first line of defence against a rising interest rate and inflation environment, the structure of its operating cost base provides the second line of defence. Companies with higher gross, operating and net margins will be far less affected in this environment, simply because they have relatively fewer costs needed to effectively run their businesses.
Table 2 breaks down $1.00 of sales into a company’s major cost categories. We have then compared the average company in the Seilern Universe against the average company in the S&P 500 ex-Financials1. As our next newsletter will be focusing on what happens to costs below the earnings before interest and tax (EBIT) line, we have highlighted the section that we will address directly in this newsletter.
Table 2: Breakdown of $1.00 of Sales (Seilern Universe vs S&P 500 ex-Financials)
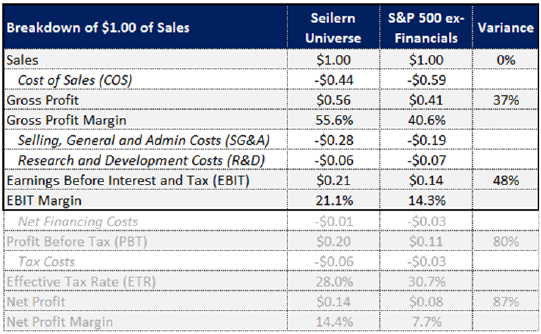
Source: Seilern, FactSet (May 2021)
A clear observation is that cost of sales (COS) is usually the largest single cost line in a company’s profit and loss (P&L) account and includes the direct material and labour costs needed to create the good or service being sold. For the average Seilern Universe company, COS accounts for 52% of its total cost base compared with 64% for the average S&P 500 ex-Financials company. Seilern Universe companies operate with a higher gross profit margin (GPM) than the broader market because of their superior pricing power and their ability to produce a product or service more efficiently.
Over the past five years, the GPM of the average Seilern Universe company has been 56% compared with 41% for the S&P 500 ex-Financials. This means that for every incremental $1.00 of sales generated by a company in the Seilern Universe, it only costs $0.44 to directly create the product or service being sold. For the average S&P 500 ex-Financials company, this cost is $0.59, which is 34% higher. In reality, however, each incremental sale typically comes at a slightly higher gross margin for the average Seilern Universe company. This is due to its superior economies of scale and its lesser need to hire more direct labour for the creation of the product or service being sold.
Selling, general and administrative (SG&A) costs are 47% higher for the average Seilern Universe company compared with the average S&P 500 ex-Financials company. Effectively, these are all the costs that indirectly go into selling and marketing the product or service. The biggest area that tends to be affected here in a rising inflationary environment will be wage inflation, which we know has been weak for many years given low productivity growth. The average Seilern Universe company tends to operate in less capital-intensive industries, where the cost focus is more on building scale across selling and distribution networks and platforms, rather than building out physical manufacturing scale. This helps explain why SG&A costs are relatively higher compared with the broader market.
Research and development (R&D) costs are 13% higher for the average S&P 500 ex-Financials company. This is not surprising given that we do not believe R&D spending is the strongest way of building a sustainable competitive advantage. The pharmaceutical industry is well known for having high R&D spending, but the return on this R&D has been falling over time. It also leads to the creation of intellectual property, which eventually expires. A rising inflation environment may lead to a rise in the future cost of R&D, which is labour intensive. On top of this, a rising interest rate environment would reduce the present value of a future R&D project, which raises the required rate of return needed to achieve commercial success.
While we are not discussing the other P&L items today, it is worth highlighting that the average Seilern Universe company operates with a net profit of around $0.14, which is 87% higher than the average company in the S&P 500 ex-Financials index. This difference creates an attractive buffer to help manage the risks associated with rising interest rates from higher input cost inflation. Superior pricing power and high (incremental) margins are the keys to creating a strong defence against a potentially changing macroeconomic backdrop.
Let us now test the above statements with two hypothetical scenarios. In Scenario 1 (Table 3), we assume that there is a uniform 5% rise in input cost inflation across the three key line items (COS, SG&A and R&D). It also assumes that no company will be able to increase its pricing in such an environment, meaning that it will simply have to accept the costs. Under such a scenario, the EBIT of the average company in the Seilern universe falls by 19%, which is a superior outcome to the 30% fall across the broader market. This happens because of its higher gross profit and EBIT margin starting position. From day one, Seilern Universe companies simply have fewer costs needed to run profitably compared with the broader market.
Table 3 (Scenario 1): What happens to margins when input costs rise?
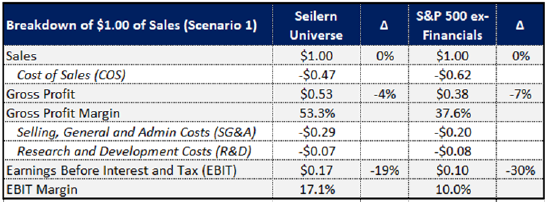
Source: Seilern, FactSet (May 2021)
Scenario 2 (Table 4) is our best attempt to replicate a real-world situation2. The assumptions made are highlighted below:
- The average Seilern Universe company has greater pricing power than the broader market, and so should be able to increase its prices above the rise in input cost inflation. We have assumed 6% growth in prices compared with the market’s 5%.
- The average Seilern Universe company also has a higher fixed cost base in its COS structure, as it needs relatively less labour in order to make the next $1.00 of incremental sales. This is part of the reason why so many software businesses make good Quality Growth candidates; they need to spend relatively less to keep building out their highly scalable infrastructures. We have assumed 4% growth compared with the market’s 5%.
- Next is SG&A, where it is fair to argue that growth in these costs would be higher for the average Seilern Universe company, as it relies more on distributing and marketing its products and services than in investing in its physical asset base. We have assumed 6% growth compared with the market’s 5%.
- Lastly, it is likely that the growth in R&D will be broadly similar for both groups as the largest cost item relates to wage growth. We have assumed 5% growth for both groups.
Table 4 (Scenario 2): What happens to margins when input costs rise?
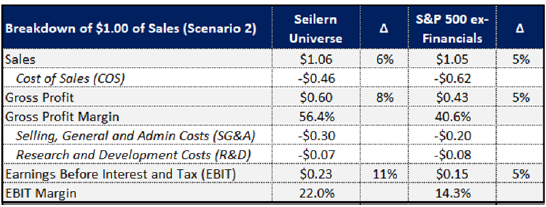
Source: Seilern, FactSet (May 2021)
There are some interesting things to take away from this hypothetical. The ability of the average company in the Seilern Universe to price above the rate of inflation, mixed with its higher operating leverage, means that it should be able to continue expanding its EBIT margin, even as costs rise. This analysis shows that EBIT grows by 11% for the Seilern Universe, which implies an operating leverage ratio of 1.8x. This would put it in the ‘Very Good’ classification outlined earlier in the newsletter. The broader market, on the other hand, would see its EBIT grow by 5%, which suggests a ‘Neutral’ operating leverage ratio of 1.0x.
Due to both its ability to raise prices above costs, and ‘plug’ those sales into a business model with higher operating leverage, the EBIT margin for the average Seilern Universe company can expand by 90 basis points, whereas it remains flat for the broader market.
Crucially, this analysis does not yet consider the changes to the net financing costs of both groups, which should result in a sharp rise in interest cost charges for the broader market, given that group’s relatively higher level of debt. This aspect, along with the impacts on capital expenditures and cash flow conversions, will be addressed in greater detail in the next monthly newsletter.
In conclusion, while there are many moving parts and much complexity in one’s attempts to forecast the future, the high-level concepts we have discussed should be quite clear. When the broad cost of doing business starts to rise around the world, there are three main levers that a company can pull in order to defend itself. The first is to raise its prices above the level of cost growth. The second is to have a high level of operating leverage in its business model. And the third is to not have to dramatically increase the amount of capital it needs to spend to win that next $1.00 of sales. These three attributes are common of Quality Growth companies, which should leave them well positioned to defend their financial performance in a higher interest rate and inflationary world.
M. Lo Blanco
31st May, 2021
1 To flatten out the effects of Covid in 2020, we have taken an average of the last five years of financial data (i.e., 2016-2020).
2 This example is clearly an oversimplification of a complex issue. It does not consider many other moving parts, including any impacts from currency movements given the fact that many companies manufacture products and provide services across a variety of markets. It also assumes a uniform rise in inflation globally, whereas wage and material input pressures vary wildly across countries. It also does not consider how volumes might grow in such a reflationary environment.
Any forecasts, opinions, goals, strategies, outlooks and or estimates and expectations or other non-historical commentary contained herein or expressed in this document are based on current forecasts, opinions and or estimates and expectations only, and are considered “forward looking statements”. Forward-looking statements are subject to risks and uncertainties that may cause actual future results to be different from expectations. Nothing in this newsletter is a recommendation for a particular stock. The views, forecasts, opinions and or estimates and expectations expressed in this document are a reflection of Seilern Investment Management Ltd’s best judgment as of the date of this communication’s publication, and are subject to change. No responsibility or liability shall be accepted for amending, correcting, or updating any information or forecasts, opinions and or estimates and expectations contained herein.
Please be aware that past performance should not be seen as an indication of future performance. Any financial instrument included in this website could be considered high risk and investors may not get back all of their original investment. The value of any investments and or financial instruments included in this website and the income derived from them may fluctuate and you may not receive back the amount originally invested. In addition stock market fluctuations and currency movements may also affect the value of investments.
Get the latest insights & events direct to your inbox
"*" indicates required fields